This post is not about economics, it’s about scripting. People who follow stocks love to see historic prices. Here I’ll show you how to get historic ASX data and do a simple plot with the wonderful open-source tool gnuplot.
Getting the data
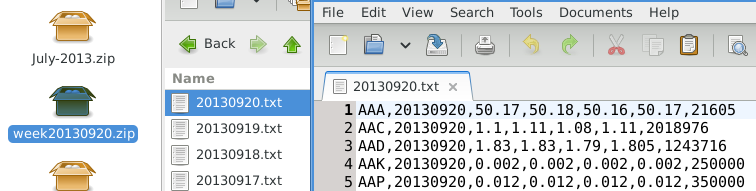
I’m uncertain who runs it, but this site offers .zip files containing basic daily data, updated each weekend. The archives have CSV files in them:
To make these useful, I joined them together and imported them into sqlite. On Debian this is in the sqlite3 package.
To turn the .zip files into a sqlite file:
- Download the files for the time period you need, and put them in a folder called “
data” - Save the script below as “
import.sh” and run it.
#!/bin/sh

# Unzip all the data files and leave the text files in the "txt" folder.
rm -f asx-historic.db
rm -Rf txt
mkdir -p txt
for i in data/*;
do
	echo -n "Extracting $i .. "
	unzip -q $i -d txt
	echo "done"
done
mv txt/*/*.txt txt/
find . -empty -delete

# Combine the text files
echo -n "Combining files .. "
cat txt/*.txt > txt/asx-historic.csv
echo "done"

# Import the text files into an sqlite db
echo -n "Creating database .. "
sqlite3 asx-historic.db -batch <<EOF
create table price (code CHAR(3), date DATE, open DECIMAL(10,3), close DECIMAL(10,3), low DECIMAL(10,3), high DECIMAL(10,3), vol);
.separator ,
.import txt/asx-historic.csv price
EOF
echo "done"
After running import.sh, the data is in a file called “asx-historic.db”. You should re-run this script with extra data when it comes out.
Querying an sqlite database
That file is a database, so you can query it with SQL like so:
mike@mikebox$ sqlite3 asx-historic.db
SQLite version 3.8.1 2013-10-17 12:57:35
Enter ".help" for instructions
Enter SQL statements terminated with a ";"
sqlite> select date, close from price where code='ASX' order by date;
20130603|37.68
20130604|37.1
20130605|36.64
20130606|36.4
...
Graphing closing prices
Line graphs in gnuplot are very simple. Save this file as line.gnuplot:
set terminal pdf
set output fout
set key left
plot fin using 2 w lines title code
Note: “fout” (file out) “fin” (file in) and “code” are variables.
This bash script lists closing prices for a code and saves them to a .dat file under a folder called “plot”.
#!/bin/bash
sqlite3 -separator $'t' asx-historic.db "select date, close from price where code='$1' order by date;" > plot/$1.dat
gnuplot -e "code='$1'" -e "fin='plot/$1.dat'" -e "fout='plot/$1.pdf'" line.gnuplot
An example usage would be:
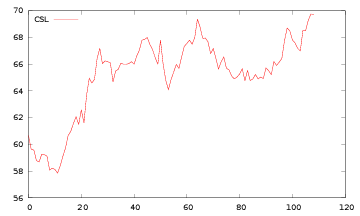
./line.sh CSL
Which (given a few months of data) looked like this:
File list
If you follow this from start-to-finish, then you should have the following files:
- data/
- (Lots of zip files)
- plot/
- CSL.dat
- CSL.pdf
- txt/
- (Lots of text files)
- asx-historic.db
- import.sh
- line.sh
- line.gnuplot