Today I’m writing a bit about a Prometheus deployment that I made last year on a Raspberry Pi, to get better data about congestion on my uplink to the Internet.
The problem
You have probably run an Internet speed test before, like this:
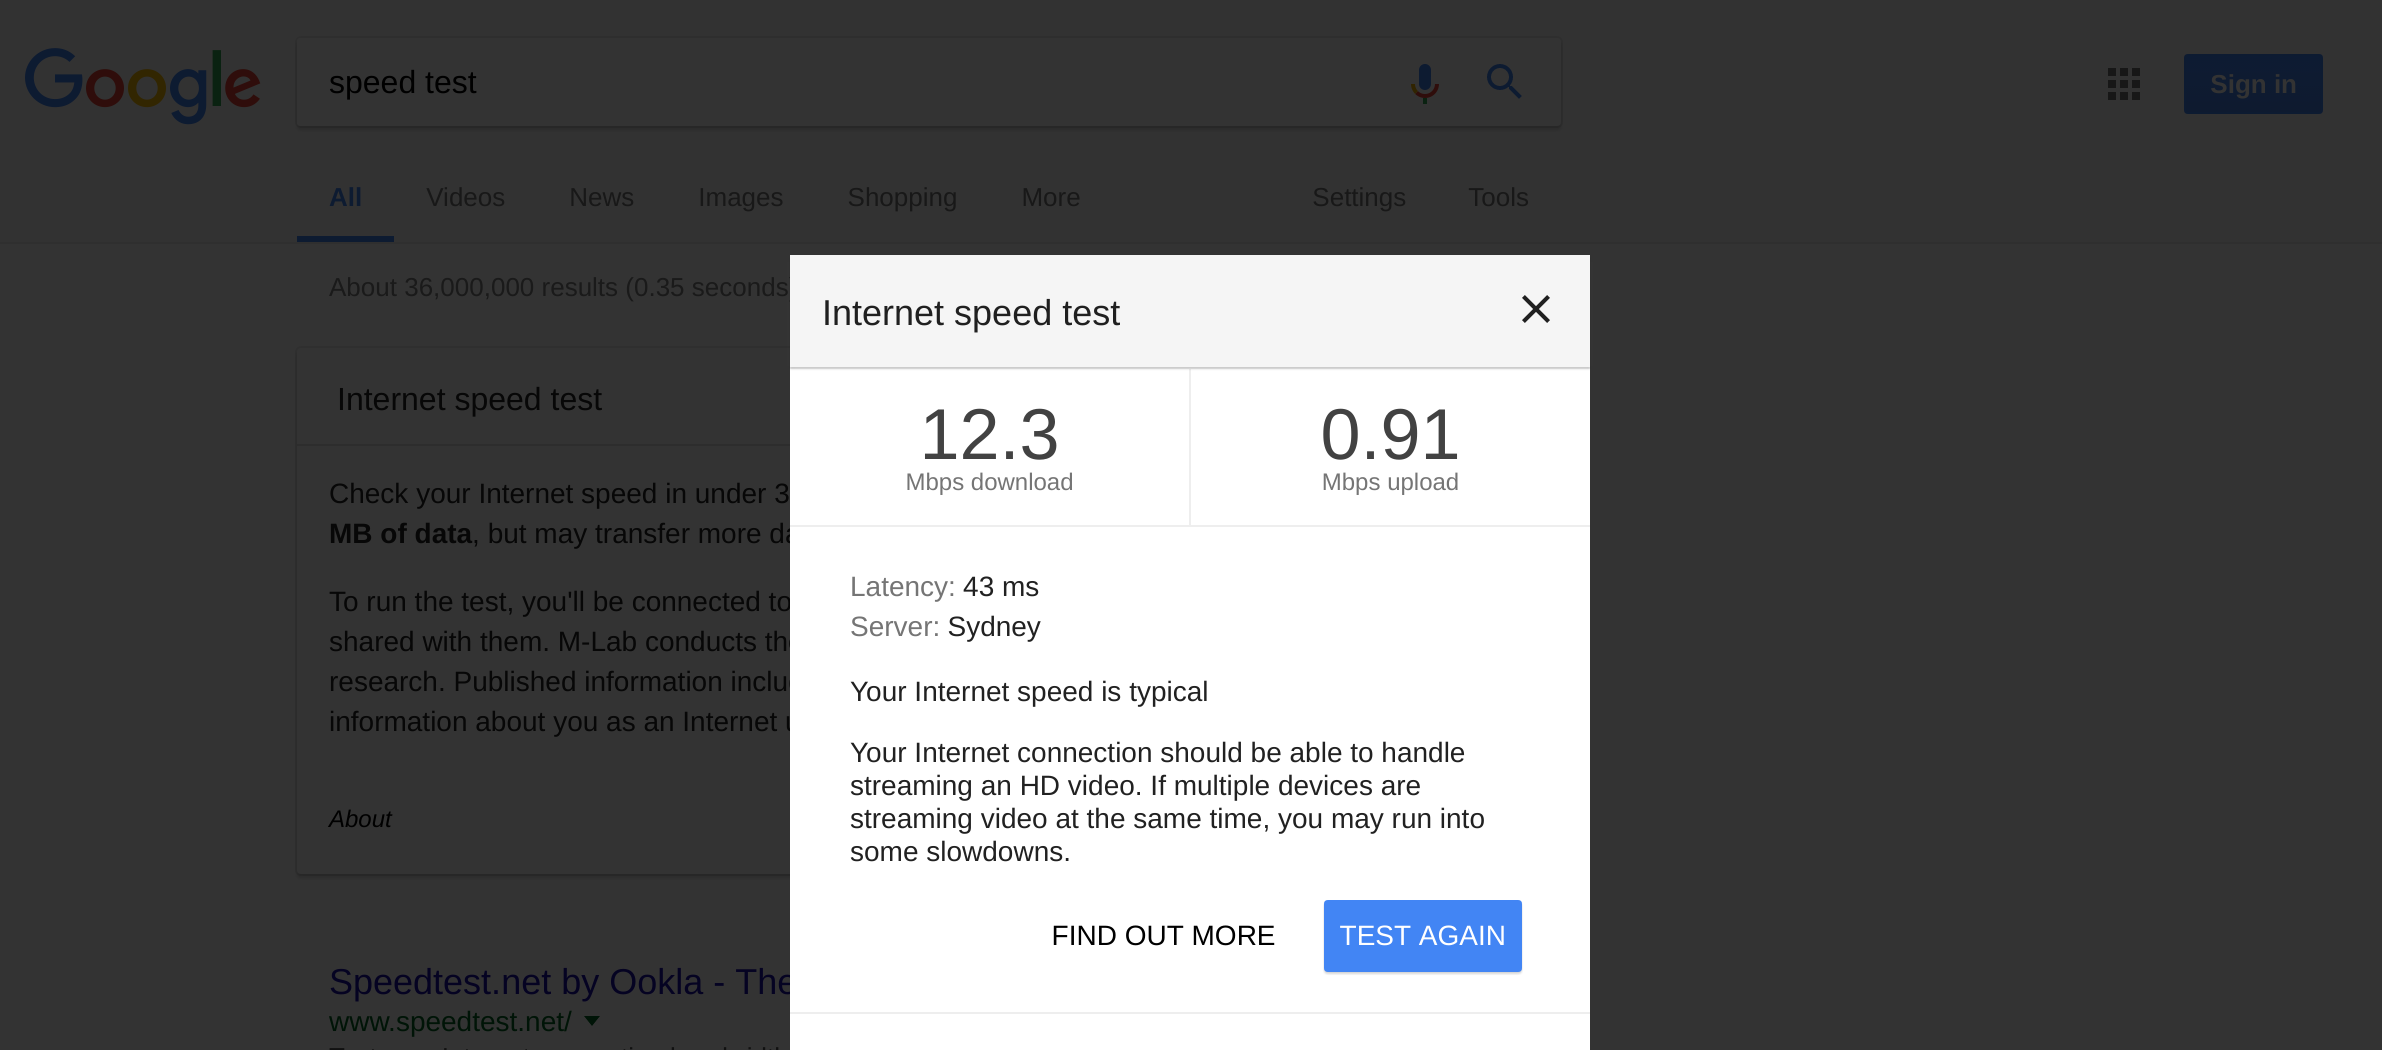
A speed test will tell you how slow your computer’s connection is, but it can’t narrow down whether it’s because of other LAN devices, the line quality, or congestion at the provider.
You can start to assemble this information from the router, which has counters for each network interface.
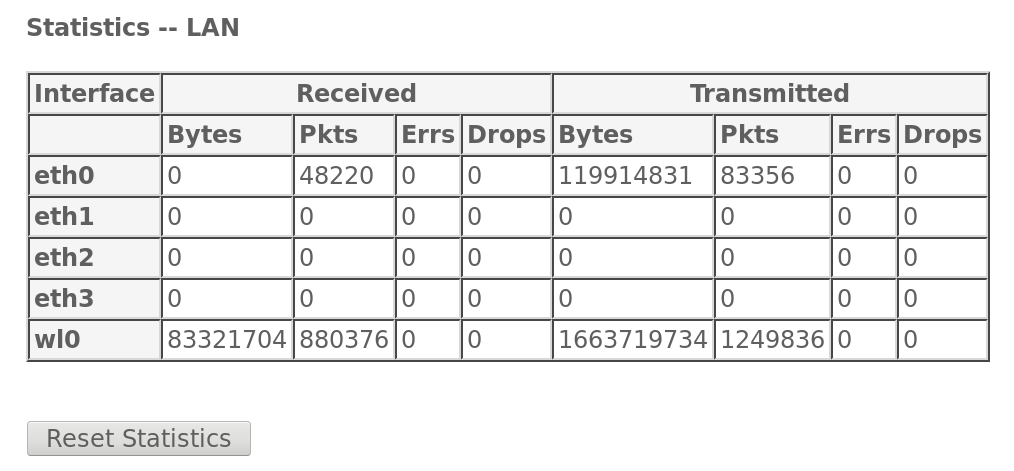
This table is from a Sagemcom F@ST 3864, which is a consumer-grade router. It has no SNMP interface, so the only way to get these metrics is to query /statsifc.html and /info.html from the LAN.
Getting the data
I can derive throughput metrics for the uplink if I scrape these metrics every few seconds and load them into a time-series database. To do this, I wrote a small adapter (called an “exporter” in Prometheus lingo), which exposed the metrics in a more structured way.
The result was a web page on the Raspberry Pi, which returns interface data like this:
# HELP lan_network_receive_bytes Received bytes for network interface
# TYPE lan_network_receive_bytes gauge
lan_network_receive_bytes{device="eth0"} 0.0
lan_network_receive_bytes{device="eth1"} 0.0
lan_network_receive_bytes{device="eth2"} 0.0
lan_network_receive_bytes{device="eth3"} 0.0
lan_network_receive_bytes{device="wl0"} 737476060.0
# HELP lan_network_send_bytes Sent bytes for network interface
# TYPE lan_network_send_bytes gauge
lan_network_send_bytes{device="eth0"} 363957004.0
lan_network_send_bytes{device="eth1"} 0.0
lan_network_send_bytes{device="eth2"} 0.0
lan_network_send_bytes{device="eth3"} 0.0
lan_network_send_bytes{device="wl0"} 2147483647.0
# HELP lan_network_receive_packets Received packets for network interface
# TYPE lan_network_receive_packets gauge
lan_network_receive_packets{device="eth0",disposition="transfer"} 1766250.0
lan_network_receive_packets{device="eth0",disposition="error"} 0.0
lan_network_receive_packets{device="eth0",disposition="drop"} 0.0
lan_network_receive_packets{device="eth1",disposition="transfer"} 0.0
lan_network_receive_packets{device="eth1",disposition="error"} 0.0
lan_network_receive_packets{device="eth1",disposition="drop"} 0.0
lan_network_receive_packets{device="eth2",disposition="transfer"} 0.0
lan_network_receive_packets{device="eth2",disposition="error"} 0.0
lan_network_receive_packets{device="eth2",disposition="drop"} 0.0
lan_network_receive_packets{device="eth3",disposition="transfer"} 0.0
lan_network_receive_packets{device="eth3",disposition="error"} 0.0
lan_network_receive_packets{device="eth3",disposition="drop"} 0.0
lan_network_receive_packets{device="wl0",disposition="transfer"} 6622351.0
lan_network_receive_packets{device="wl0",disposition="error"} 0.0
lan_network_receive_packets{device="wl0",disposition="drop"} 0.0
# HELP lan_network_send_packets Sent packets for network interface
# TYPE lan_network_send_packets gauge
lan_network_send_packets{device="eth0",disposition="transfer"} 3148577.0
lan_network_send_packets{device="eth0",disposition="error"} 0.0
lan_network_send_packets{device="eth0",disposition="drop"} 0.0
lan_network_send_packets{device="eth1",disposition="transfer"} 0.0
lan_network_send_packets{device="eth1",disposition="error"} 0.0
lan_network_send_packets{device="eth1",disposition="drop"} 0.0
lan_network_send_packets{device="eth2",disposition="transfer"} 0.0
lan_network_send_packets{device="eth2",disposition="error"} 0.0
lan_network_send_packets{device="eth2",disposition="drop"} 0.0
lan_network_send_packets{device="eth3",disposition="transfer"} 0.0
lan_network_send_packets{device="eth3",disposition="error"} 0.0
lan_network_send_packets{device="eth3",disposition="drop"} 0.0
lan_network_send_packets{device="wl0",disposition="transfer"} 8803737.0
lan_network_send_packets{device="wl0",disposition="error"} 0.0
lan_network_send_packets{device="wl0",disposition="drop"} 0.0
# HELP wan_network_receive_bytes Received bytes for network interface
# TYPE wan_network_receive_bytes gauge
wan_network_receive_bytes{device="ppp2.1"} 3013958333.0
wan_network_receive_bytes{device="ptm0.1"} 0.0
wan_network_receive_bytes{device="eth4.3"} 0.0
wan_network_receive_bytes{device="ppp1.1"} 0.0
wan_network_receive_bytes{device="ppp3.2"} 0.0
# HELP wan_network_send_bytes Sent bytes for network interface
# TYPE wan_network_send_bytes gauge
wan_network_send_bytes{device="ppp2.1"} 717118493.0
wan_network_send_bytes{device="ptm0.1"} 0.0
wan_network_send_bytes{device="eth4.3"} 0.0
wan_network_send_bytes{device="ppp1.1"} 0.0
wan_network_send_bytes{device="ppp3.2"} 0.0
# HELP wan_network_receive_packets Received packets for network interface
# TYPE wan_network_receive_packets gauge
wan_network_receive_packets{device="ppp2.1",disposition="transfer"} 11525693.0
wan_network_receive_packets{device="ppp2.1",disposition="error"} 0.0
wan_network_receive_packets{device="ppp2.1",disposition="drop"} 0.0
wan_network_receive_packets{device="ptm0.1",disposition="transfer"} 0.0
wan_network_receive_packets{device="ptm0.1",disposition="error"} 0.0
wan_network_receive_packets{device="ptm0.1",disposition="drop"} 0.0
wan_network_receive_packets{device="eth4.3",disposition="transfer"} 0.0
wan_network_receive_packets{device="eth4.3",disposition="error"} 0.0
wan_network_receive_packets{device="eth4.3",disposition="drop"} 0.0
wan_network_receive_packets{device="ppp1.1",disposition="transfer"} 0.0
wan_network_receive_packets{device="ppp1.1",disposition="error"} 0.0
wan_network_receive_packets{device="ppp1.1",disposition="drop"} 0.0
wan_network_receive_packets{device="ppp3.2",disposition="transfer"} 0.0
wan_network_receive_packets{device="ppp3.2",disposition="error"} 0.0
wan_network_receive_packets{device="ppp3.2",disposition="drop"} 0.0
# HELP wan_network_send_packets Sent packets for network interface
# TYPE wan_network_send_packets gauge
wan_network_send_packets{device="ppp2.1",disposition="transfer"} 7728904.0
wan_network_send_packets{device="ppp2.1",disposition="error"} 0.0
wan_network_send_packets{device="ppp2.1",disposition="drop"} 0.0
wan_network_send_packets{device="ptm0.1",disposition="transfer"} 0.0
wan_network_send_packets{device="ptm0.1",disposition="error"} 0.0
wan_network_send_packets{device="ptm0.1",disposition="drop"} 0.0
wan_network_send_packets{device="eth4.3",disposition="transfer"} 0.0
wan_network_send_packets{device="eth4.3",disposition="error"} 0.0
wan_network_send_packets{device="eth4.3",disposition="drop"} 0.0
wan_network_send_packets{device="ppp1.1",disposition="transfer"} 0.0
wan_network_send_packets{device="ppp1.1",disposition="error"} 0.0
wan_network_send_packets{device="ppp1.1",disposition="drop"} 0.0
wan_network_send_packets{device="ppp3.2",disposition="transfer"} 0.0
wan_network_send_packets{device="ppp3.2",disposition="error"} 0.0
wan_network_send_packets{device="ppp3.2",disposition="drop"} 0.0
# HELP adsl_attainable_rate_down_kbps ADSL Attainable Rate down (Kbps)
# TYPE adsl_attainable_rate_down_kbps gauge
adsl_attainable_rate_down_kbps 19708.0
# HELP adsl_attainable_rate_up_kbps ADSL Attainable Rate up (Kbps)
# TYPE adsl_attainable_rate_up_kbps gauge
adsl_attainable_rate_up_kbps 1087.0
# HELP adsl_rate_down_kbps ADSL Rate down (Kbps)
# TYPE adsl_rate_down_kbps gauge
adsl_rate_down_kbps 18175.0
# HELP adsl_rate_up_kbps ADSL Rate up (Kbps)
# TYPE adsl_rate_up_kbps gauge
adsl_rate_up_kbps 1087.0
# HELP process_virtual_memory_bytes Virtual memory size in bytes.
# TYPE process_virtual_memory_bytes gauge
process_virtual_memory_bytes 34197504.0
# HELP process_resident_memory_bytes Resident memory size in bytes.
# TYPE process_resident_memory_bytes gauge
process_resident_memory_bytes 22441984.0
# HELP process_start_time_seconds Start time of the process since unix epoch in seconds.
# TYPE process_start_time_seconds gauge
process_start_time_seconds 1497148890.92
# HELP process_cpu_seconds_total Total user and system CPU time spent in seconds.
# TYPE process_cpu_seconds_total counter
process_cpu_seconds_total 3254.92
# HELP process_open_fds Number of open file descriptors.
# TYPE process_open_fds gauge
process_open_fds 7.0
# HELP process_max_fds Maximum number of open file descriptors.
# TYPE process_max_fds gauge
process_max_fds 1024.0
I then deployed Prometheus to the same Raspberry Pi, and configured it to read these metrics every few seconds by editing prometheus.yml
global:
  scrape_interval: 5s

scrape_configs:
  - job_name: net
    static_configs:
    - targets: ["localhost:8000"]
Making some queries
Prometheus has a query language, which I find similar to spreadsheet formulas. You can enter a query directly into the web interface to get a graph or data table.
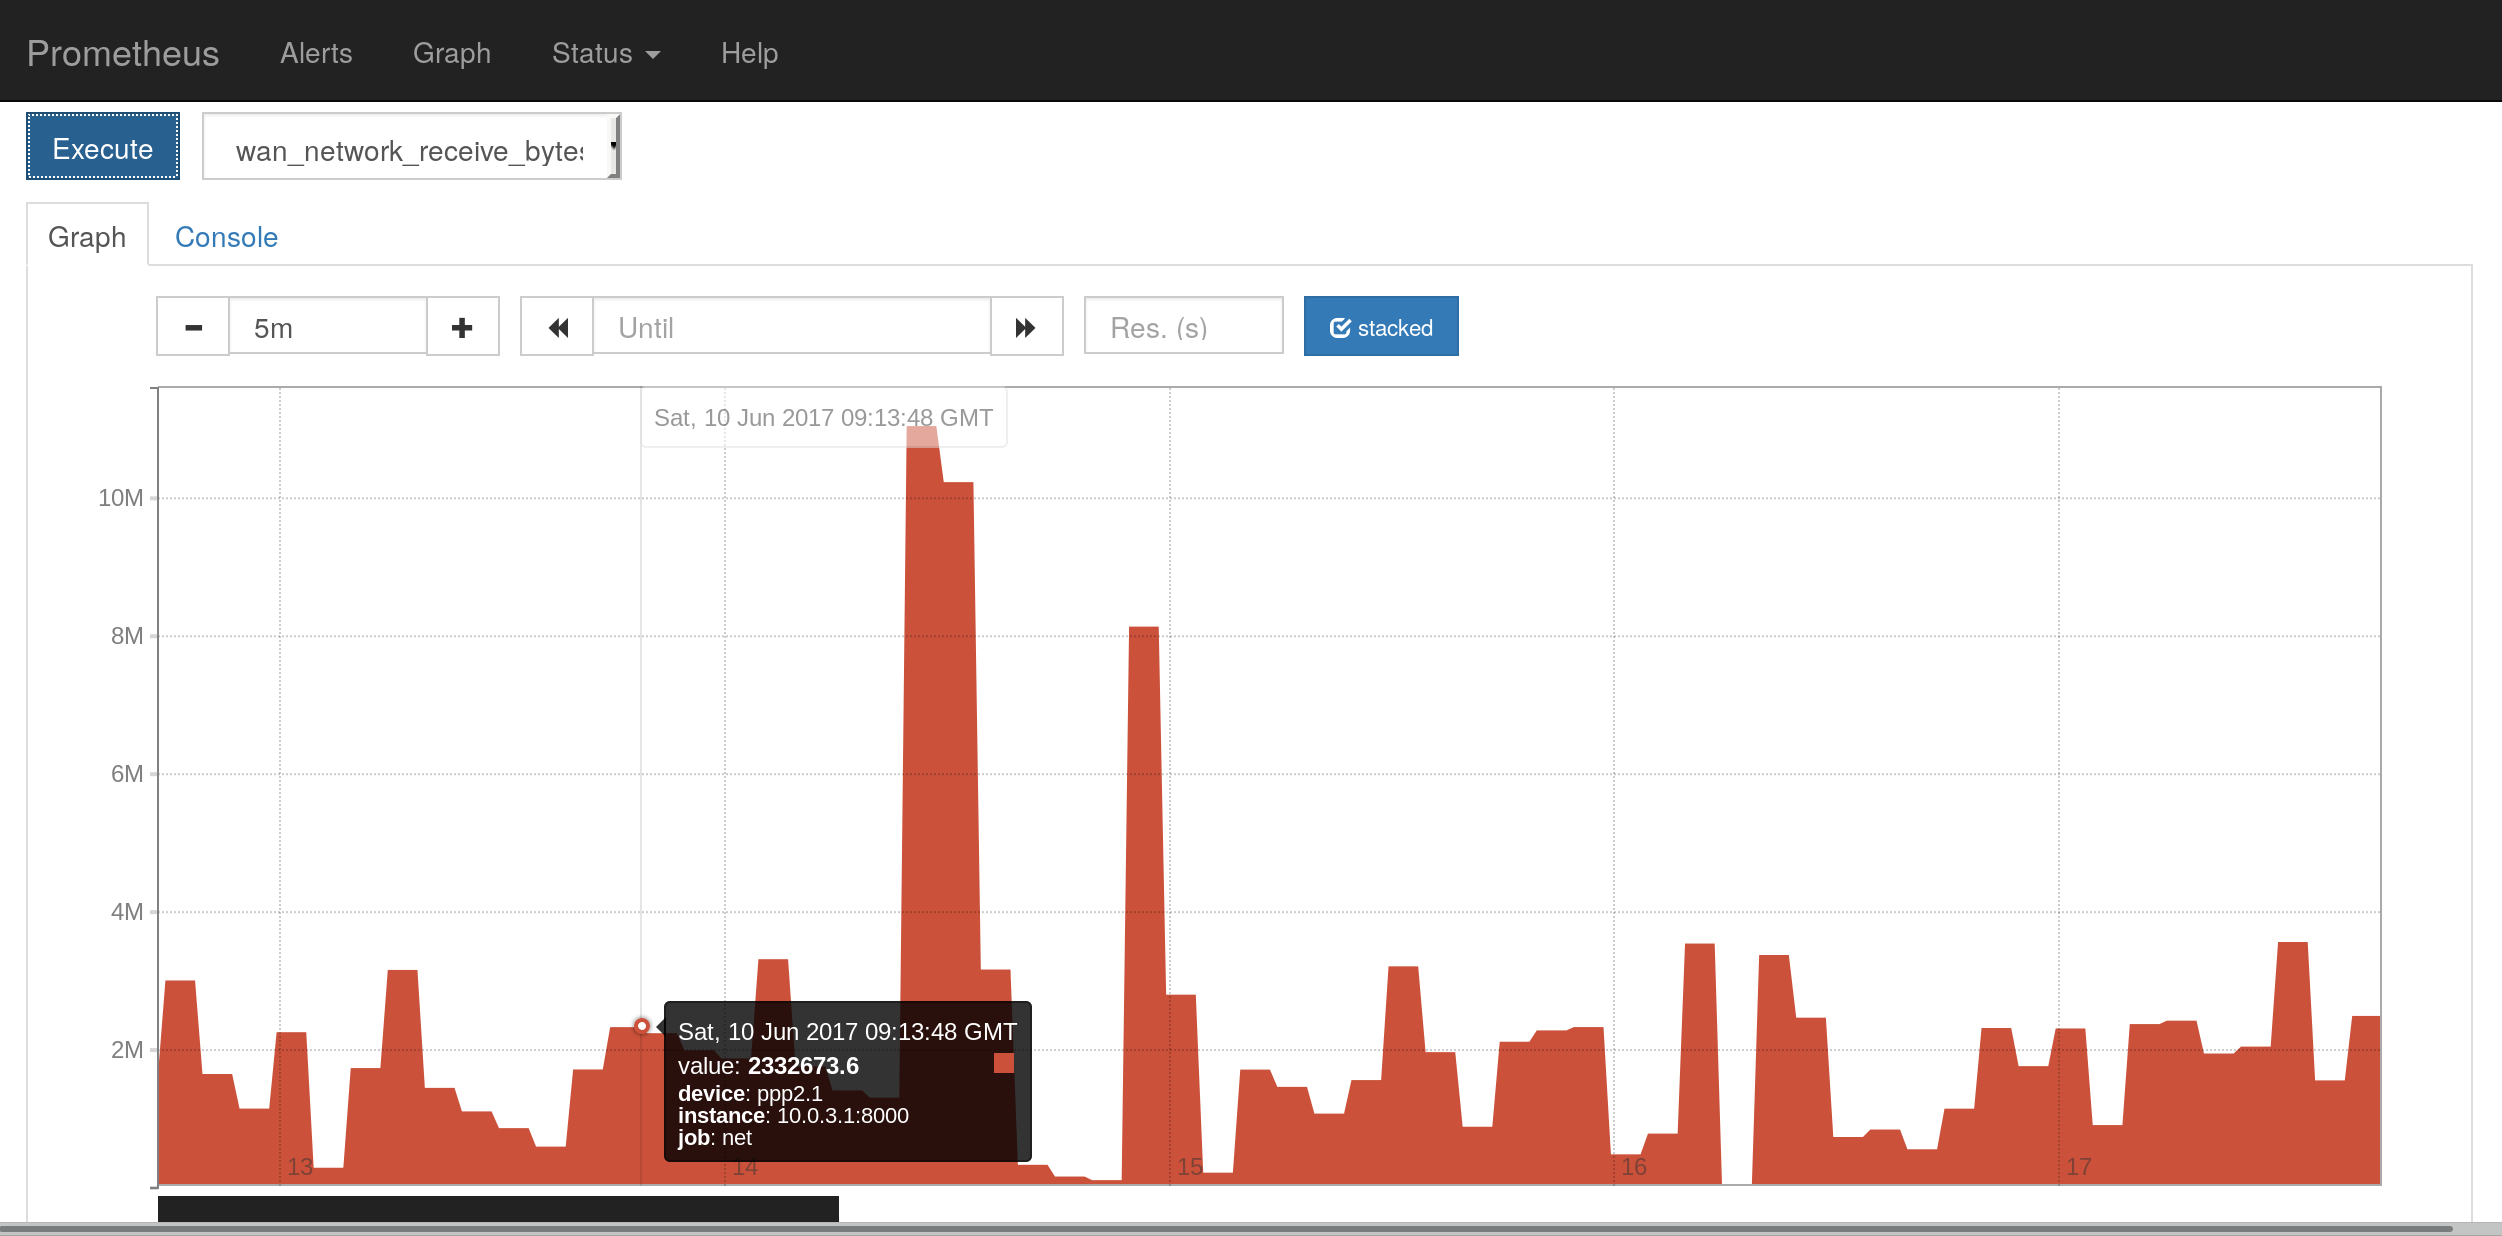
I settled on these queries to get the data I needed. They show me the maximum attainable line rate, actual sync rate, and current throughput over the WAN interface.
Download rate
Throughput:
rate(wan_network_receive_bytes{device="ppp2.1"}[10s])*8/1024/1024
ADSL attainable:
adsl_attainable_rate_down_kbps/1024
ADSL sync:
adsl_rate_down_kbps/1024
Upload rate
Usage:
rate(wan_network_send_bytes{device="ppp2.1"}[10s])*8/1024/1024
ADSL attainable:
adsl_attainable_rate_up_kbps/1024
ADSL sync:
adsl_rate_up_kbps/1024
Onto a dashboard
I then deployed the last component in this setup, Grafana, to the Raspberry Pi. This tool lets you save your queries on a dashboard.
I made two plots, one for uploads, and one for downloads:
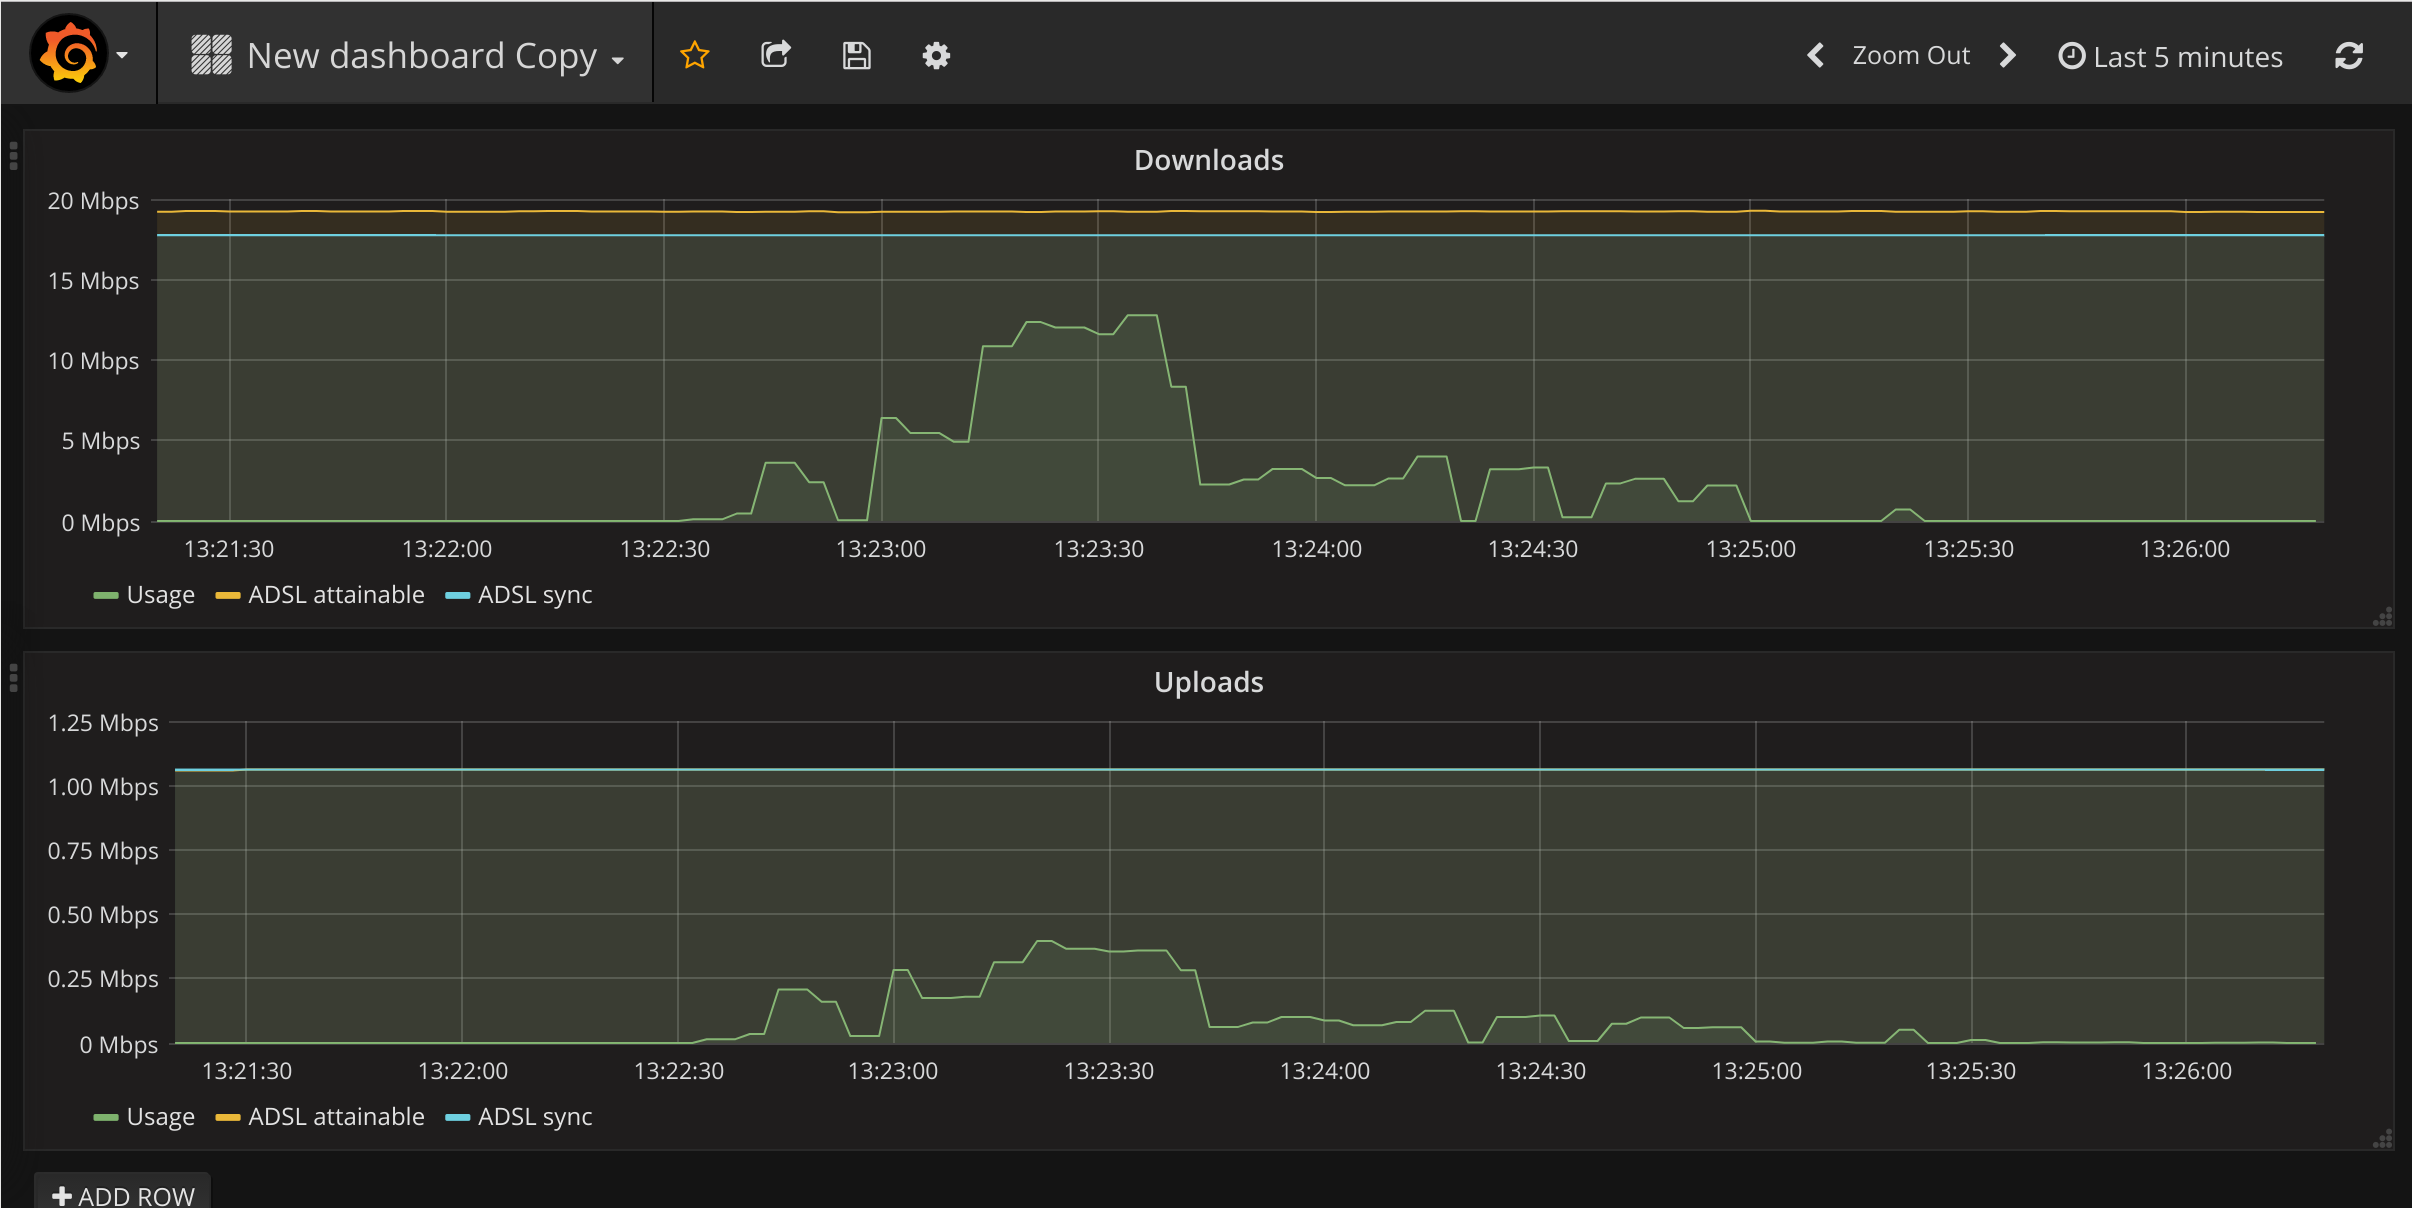
By saturating the link with traffic (such as when running a speed test), it was now possible to compare the actual network speed with the ADSL sync speed.
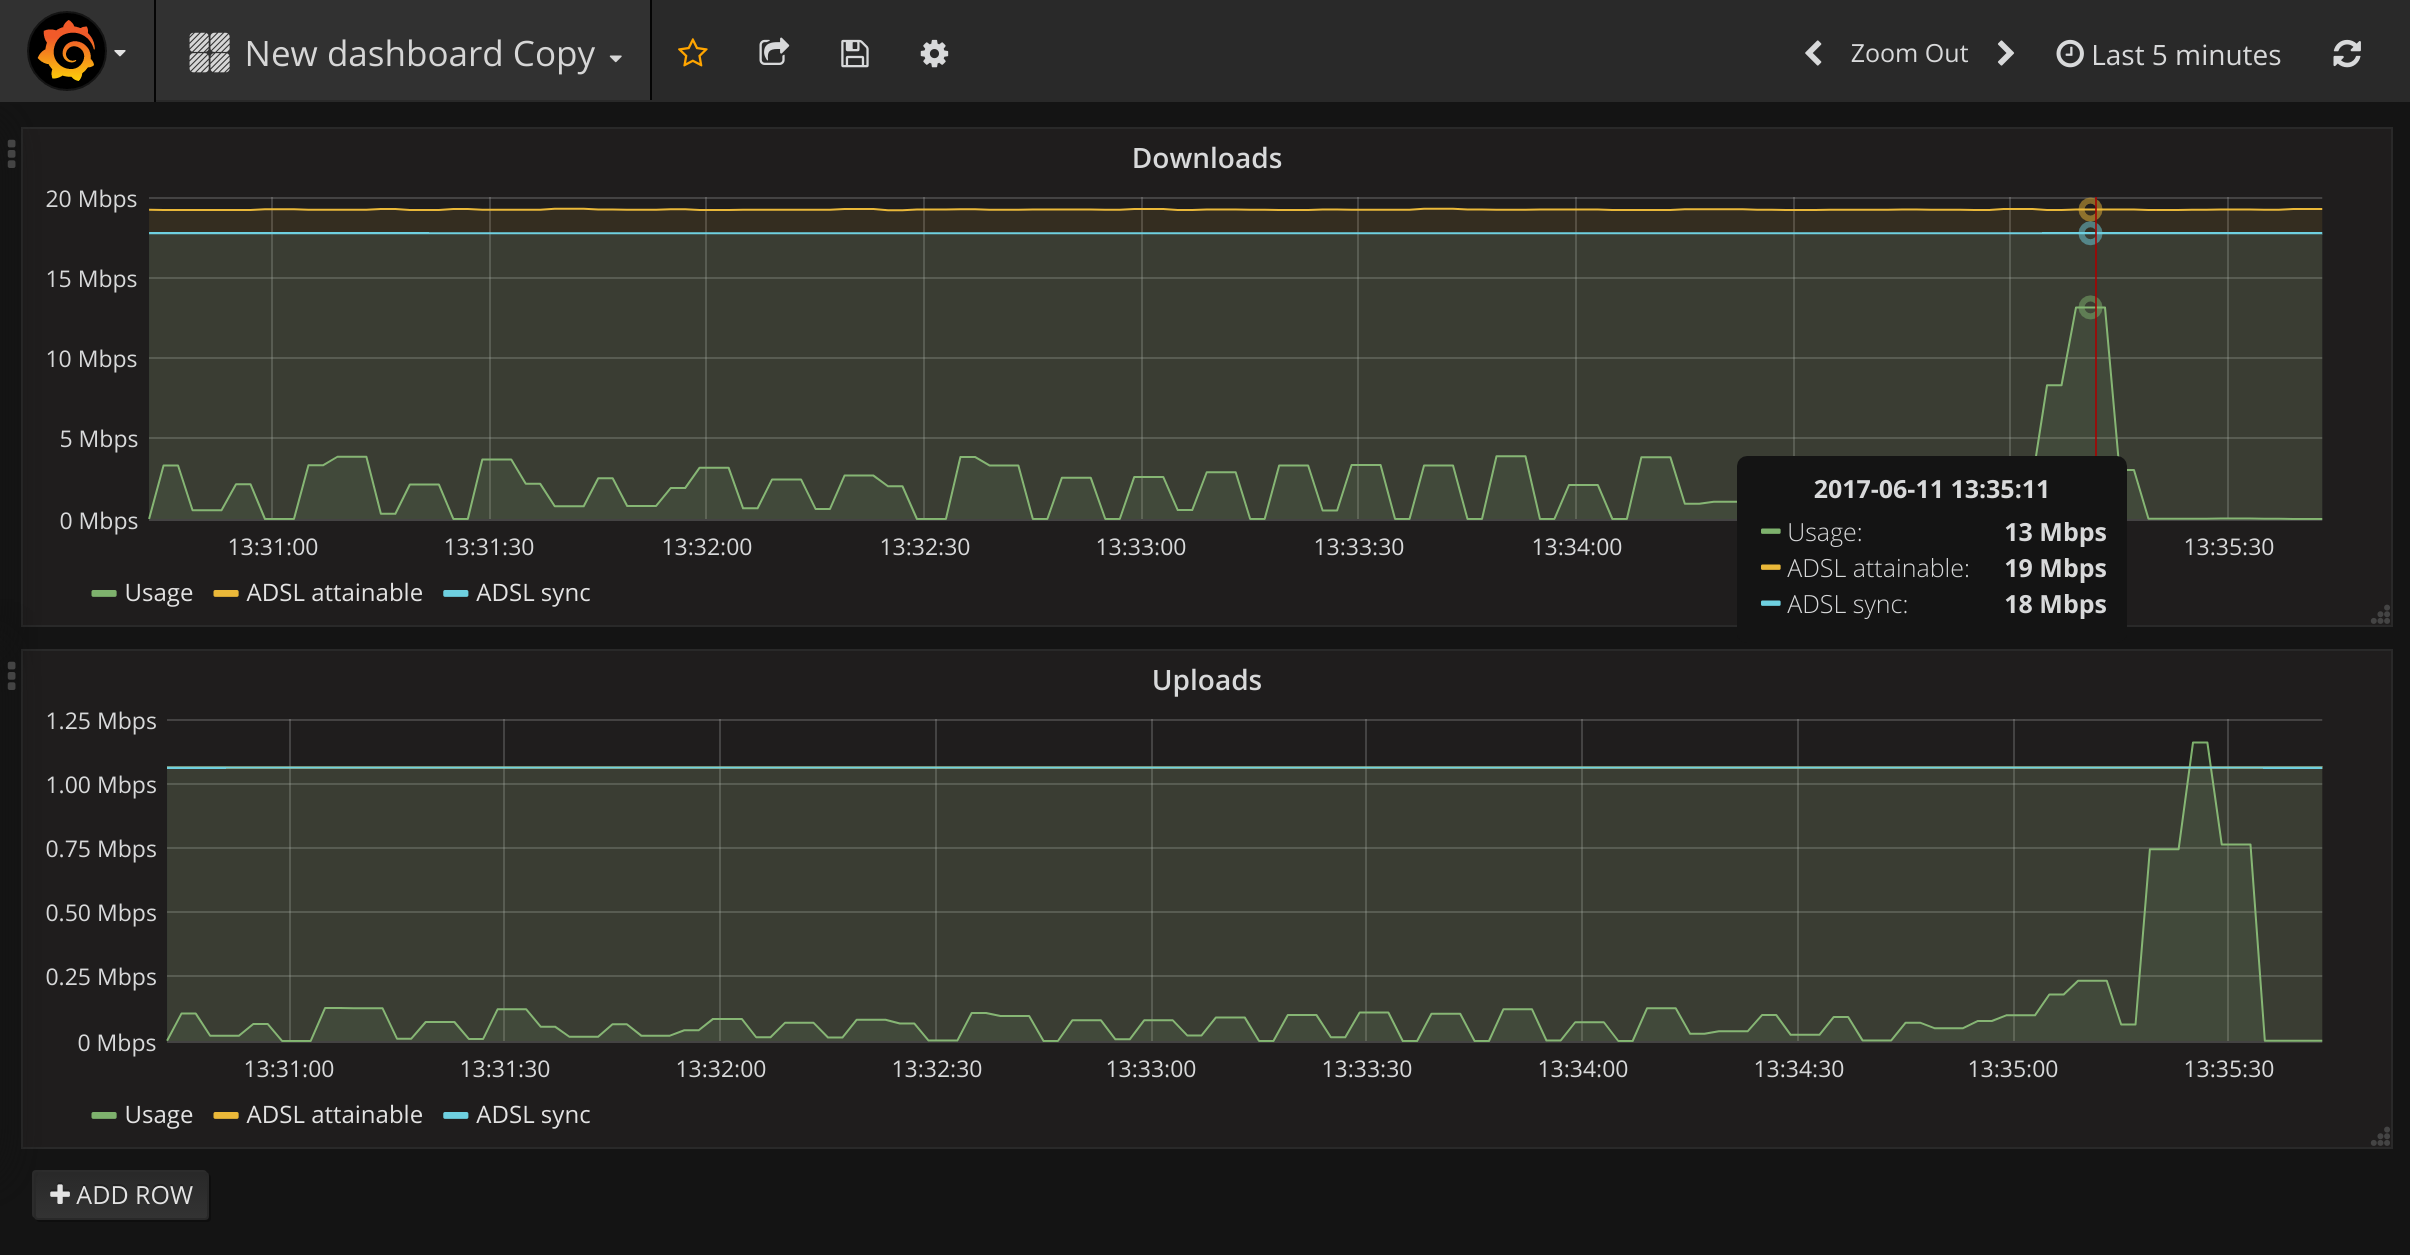
In my case, the best attainable network speed changed depending on the time of day, while the ADSL sync speed was constant. That’s a simple case of congestion.
Conclusion
I’ve deployed a few tiny Prometheus setups like this, because of how simple it is to work with new sources of metrics. It’s designed for much larger setups than an individual router, so it’s a worthwhile tool to be familiar with. Data is always a good reality-check for your assumptions, of course.
This setup had the level of security that you would expect of a Raspberry Pi project (none), and crashed after 4 days because I did didn’t configure Grafana for a RAM-limited environment. It was still a useful learning exercise, so I uploaded the python and Ansible code to GitHub at mike42/network-speed-graphs.